It’s time for another fun and insightful infographic developed and produced by my friends at ratehub.ca.
This infographic draws data from two major reports released earlier this year by authorities on the subject of Canadian mortgages. How do you compare to the national figures? CMHC’s 2013 Mortgage Consumer Survey and CAAMP’s Change in the Canadian Mortgage Market report.
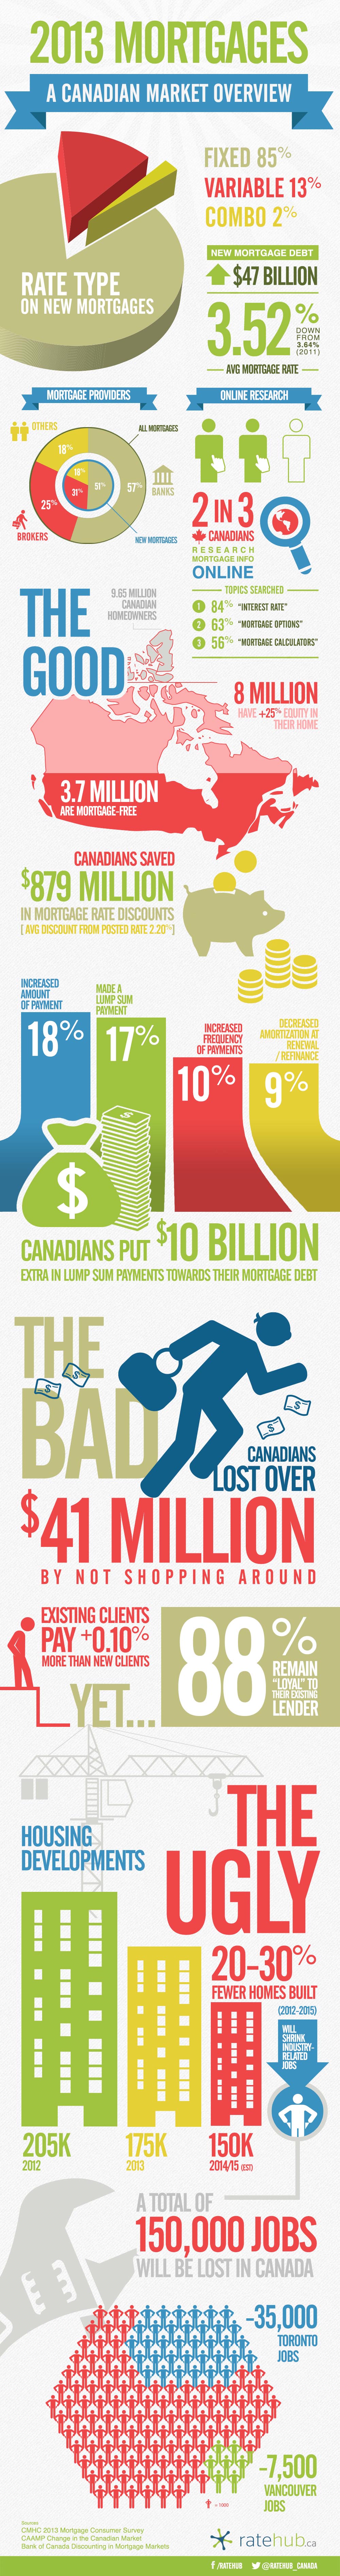
The infographic highlights some of the most practical data of the report to provide a comprehensive overview of the Canadian mortgage market. Everything from which rate types Canadians are choosing, to how much mortgage research and shopping is being done online, to which mortgage providers are the most popular, all the way to how much the average borrower is over paying by not shopping their mortgage at maturity.
Of particular interest are the stats regarding mortgage pre-payment:
- 18% of Canadians increased their payment amount
- 17% made a lump-sum payment
- 10% increased the frequency of payment
- 9% decreased their amortization at renewal or refinance.
It is good to see that some borrowers are taking advantage of the tools and features built into their mortgage to save money. But it also means that less than one in 5 of us is taking advantage of low rates to get ahead in their mortgage to become mortgage-free sooner.
So how do you compare with some of the national mortgage figures? If you have a mortgage are you typical of a Canadian mortgage borrower? If you are about to step into the market will you fit the national profile? Leave me your comments below.
By the way, if you enjoyed this post be sure to checkout 5 Awesome Facts About The Canadian Mortgage Market .